Assessment of the global transition to low-carbon energy from the lens of EROI
Can we use our low-carbon energy sources to meet our standard of living and address energy workload of climate mitigation at the same time.

Key points from this article:
- → Important to assess emission intensity and Energy return on investment (EROI) in conjunction for our renewables to see whether they meet our near future energy workloads.
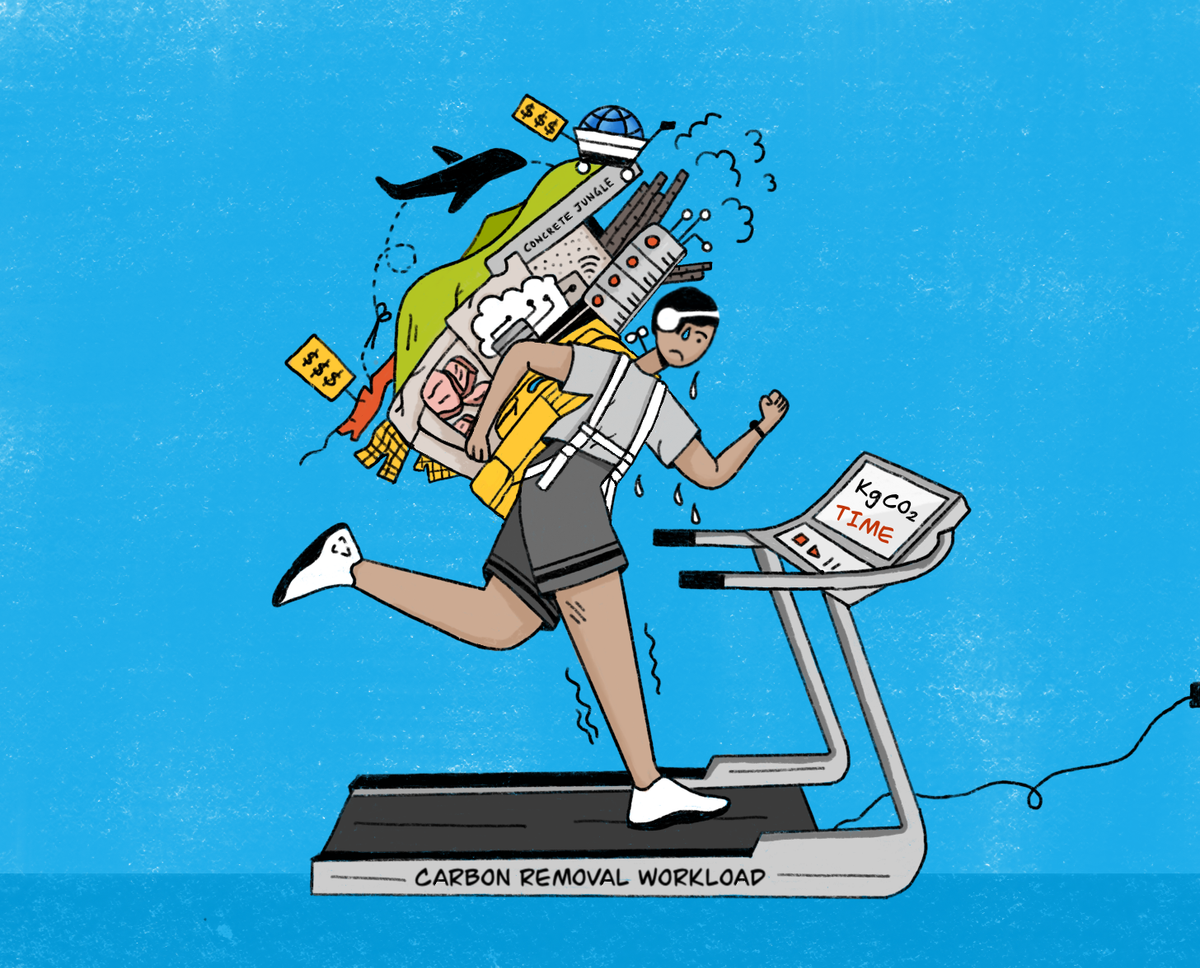
- → We have multiple competing global energy workloads: Raise standard of living in developing countries, industrial carbon removal projects, adaptation for extreme climate events, AI development and geopolitical wars.
- → Energy transition away from fossil fuels is a must to meet climate targets but renewable infrastructure still not ready to give consistently high EROI like fossil fuels due to intermittency. Reliable long duration grid storage is missing.
- → Energy transition is not going to be smooth, hence precautionary way is to reduce our fossil fuels consumption until renewables +storage reaches a certain threshold level of global energy coverage.
It is well established that greenhouse gas emissions (GHG) are contributing to climate change and emission intensity expressed as kg CO2e/kWh of electricity produced is used typically to evaluate low carbon footprint options in the global energy sector. However, relying solely on emission intensity for evaluation leads to carbon tunnel vision[1], thereby neglecting deeper issues with the transition. Hence it is useful to contrast emission intensity with another fundamental metric known as Energy return on investment (EROI) to understand whether we can use our low-carbon energy sources (renewables) to meet our standard of living and address energy workload of climate change mitigation at the same time.
EROI is defined as ratio of energy output to energy input or can be understood as ratio of energy returned to energy invested for any energy source. Naturally a higher EROI is desirable. This metric was devised by Charles A.S. Hall in 1984 to compare the performance of various energy sources.
To begin simply, positive value of EROI means that fuel is a net energy source and negative value means it is an energy sink. EROI of 1:1 means our energy returned is equal to energy invested hence we do not have any spare energy left to put to work. As EROI goes up, we get more spare energy at our disposal for our wants. To get a better understanding of EROI moving higher from 1, I am paraphrasing from the Charles A.S Hall’s 2013 interview transcript[2] with Scientific American, where he elegantly explains the concept of EROI by taking oil extraction as an example:
If you have got an EROI of 1.1, you can pump the oil out of the ground and look at it. If you have got 1.2, you can refine the oil and look at it. At 1.3, you can move the oil to where you want it and look at it. You need a minimum EROI of 3 at the wellhead to drive a truck. Now, you need to have an EROI of 5 to put anything in the truck, like grains. And that includes the depreciation for the truck. Further, you need an EROI of 7 to support the families of the truck driver, the oil worker and the farmer. And if you want education for them, you need 8 or 9. And if you want health care for them, you need 10 or 11.
As you can see, we need minimum EROI of 7-9 from our energy sources for a comfortable functioning of the industrial society we live in. Keeping this in mind we will analyze the historical EROI trend of our primary energy sources (fossil fuels), assess the EROI of the low carbon energy options in supporting our current material standard of living and understand the global energy workload of mitigating the climate crisis in this article.
Calculation methodology and limitations of EROI as a metric
A system boundary is drawn in the supply chain (extraction, processing, transportation and end use) to calculate the EROI at any of the 4 stages. For any stage, the output energy delivered (after accounting for energy lost in conversion to heat) is divided by the summation of all the energy inputs to get the EROI. Typically, EROI is either calculated either at the first stage, point of extraction (ST) or the last stage, point of use (POU) of that fuel. EROIST > EROIPOU because as you move further down the supply chain the EROI value will decrease because of the energy spent in processing and transporting the fuel to the end user. For the interview transcript above, EROI of oil was referenced at the point of extraction. Also, while comparing EROI of two energy sources it is necessary to compare the values with the same system boundary for apples-to-apples comparison. This due diligence is done in the analyses for this article. There is a wide range of EROI values for the same energy source in the literature arising due to differences in technology used, geographic location, operational practices etc. Further, in some papers EROI was published as a range and not as a single value. Considering these factors along with this article's s primary focus on the qualitative interlinkage of EROI with macro factors, recent aggregated EROI estimates at point of extraction of individual energy sources are used for the analysis.
The usefulness of EROI as a metric has its limitations and criticism within the scientific community. EROI is mostly criticized on its 'time factor' deficiency as it doesn't shine light on the energy payback time, which is commonly used to assess renewable energy options. Secondly, techno-economic modelling is warranted on top of EROI analysis to study energy sources or systems. Thirdly, as Schalk Cloete from Norway's SINTEF research organization mentions “The true EROI of a technology is just too complex to quantify accurately, given the challenges with assessing full lifecycle energy inputs, converting between different energy sources, and accounting for effects on the rest of the energy system”. Despite its limitations EROI has its value in quick first cut analysis of energy options for our transition, which we will do in this article.
The golden era of high EROI
From 1940-1990, globally we used coal and oil as our primary energy sources and the reason for this is they had an average EROIST range of 30-60 in that time period. Hence EROI of 4X-7X of the comfortable EROI of 7-9 was one of the core driving forces (in addition to low population, good governance, and pro wealth creation culture) among for the fast development of the western economies in that period. It was a period where, beyond sustenance, lot of discretionary energy was available for entertainment, arts and other recreational fun. This ensured western societies and oil rich countries in the Middle east enjoy very high material standard of living. This also ensured middle class sustenance of large population across the world, especially in China and India.
All good times come to an end
Post 1990 and entering the 21st century, there was a global decline of EROI of these fossil fuels due to high per capita energy consumption in the developed countries and population jump in the developing countries seeking similar lifestyle. Now in most oil extraction sites around the world we can expect EROI of 15-20, except maybe for few sites in the Middle east where oil can still be extracted from surface exploration. For any non-renewable energy source (fossil fuels), EROI will decline with time because we need to go much further and deeper to extract the same amount of oil. As we go further and further offshore, away from the sweet spots of oil formations, we must do fracking and horizontal drilling to take out the oil which becomes very energy intensive, thereby EROI goes down and becomes uneconomical at some point. Although oil and gas exploration in the Middle east haven’t reached offshore yet, it is a reasonable assertion that they are diversifying to tourism, sports and service-based economy in light of the declining EROI of oil.
EROI evaluation of our energy choices
As we transition to renewables and other low carbon energy sources, maximizing EROI from them is equally important (if not more) as reducing their emission intensities. Figure 1 shows the plot of emission intensity vs EROI for all energy sources used in global production for 2020. The size of the bubbles on the graph indicates their relative production volume for 2020. All the details on the data sources for this graph are in the Appendix of this article.
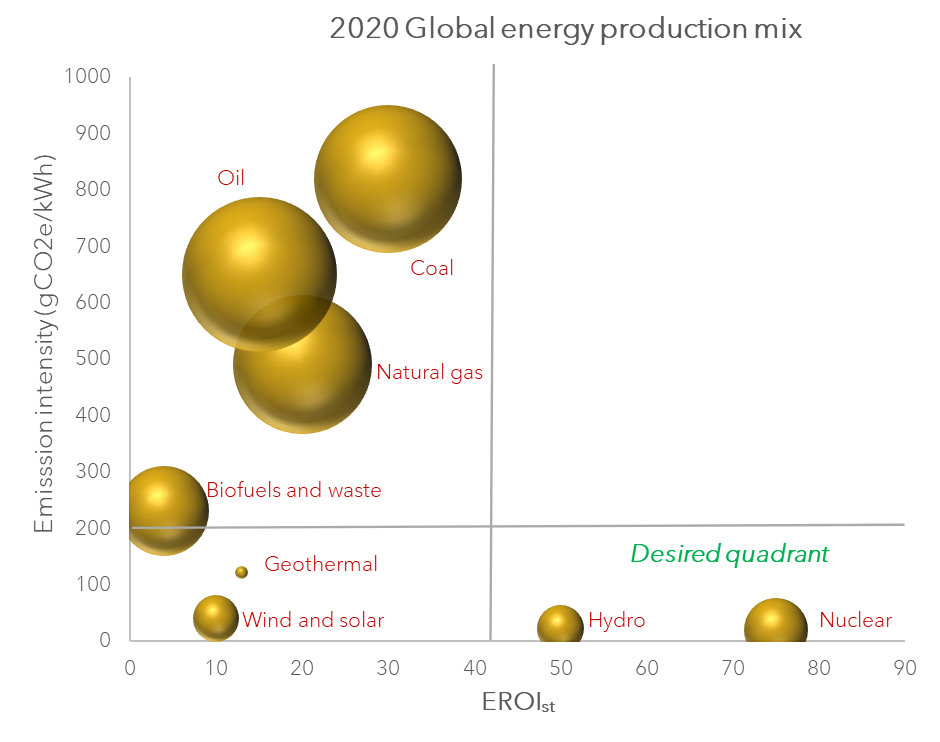
As we can see in Figure 1, it would be desirable for bulk of our energy production to be in the lower right-hand quadrant of the graph as that would ensure best of both worlds (high EROI and low emission intensities) but that is not the case with our current global energy production, which is still dominated by emission intensive fossil fuels.
Presently, fossil fuels still have an edge over renewables due to their slightly high EROI range (15-30) but declining steadily with each passing year. Global peak oil production is expected this decade, slowing the renewables transition. Biofuels is not encouraging for the energy transition due to their limited EROI range of 2-4 globally. Wind and solar are producing consistent EROI of 10-15 however, efficiency breakthroughs in solar wafers (perovskite cells) and improved wind turbine designs will improve their EROI in the near future. It is notable that wind turbine manufacturer Vestas has claimed some of their latest turbines are giving EROI of 32-41. This will further accelerate the price parity of renewable electricity generation as compared to coal (aided by its declining EROI too). However, intermittency in power generation of renewables necessitates the need for battery storage for reliable and continuous supply, which partially negates the EROI gain from efficiency improvements, due to the additional energy expenditure required for building the storage facility. EROI modelling of the grid with renewables and long duration stationary energy storage is going to get complex and be key topic of research in the near future.
Although Hydro and Nuclear are in the desired quadrant on the graph, Hydro is logistically not scalable across the world and not sufficient to meet global energy demand. This leaves us with nuclear fission/fusion to get us very high EROI and low emission intensity. Nuclear fission faces regulatory hurdles, historical safety concerns and takes longer time and higher capital to get the plant running as compared with deploying solar or wind farms. Cost of developing nuclear energy remains high from dollars to unit electricity generated ($/MWh) metric. Latest estimate[3] of the cost of nuclear fission production is around 95$ /MWh as compared with 30-40$/MWh for land based solar and wind farms. Small modular reactors (SMR’s) do give us hope in removing some of the negative factors in scaling up nuclear fission energy but the timeline of them going commercial will probably not happen before climate crisis hits an inflection point. Nuclear fusion is still considered as the holy grail and despite the recent laboratory breakthrough[4] in getting net positive ignition (outputting more energy than put in), major engineering challenges[5] remain in scaling up to a commercial fusion reactor. It is worth noting here that energy requirements in scaling up the fusion reactor from lab scale to pilot scale to commercial scale is very non-linear and hence we will run into a risk of justifying the fossil fuel energy investment into nuclear fusion in the future when we may have to instead allocate that energy to deal with mitigation and adaptation aspects of climate change.
ESOI of fuel cells
It is worth discussing briefly about fuel cells like Lithium-ion and hydrogen cell batteries because they are increasingly becoming part of the modern energy mix. I had excluded them in Figure 1 because they are represented under the metric of ESOI (ratio of energy stored to energy invested) and ESOI data for them is not well established due to their relatively real-world operational infancy. Preliminary estimates of ESOI for Li and green hydrogen fuel cells are 10 and 6 respectively (See Appendix for data source). They cannot substitute fossil fuels but offers partial replacement. Long duration storage technology's ESOI is forthcoming and would be key to lowering grid intermittency. If you are wondering about the ESOI of lead acid battery, the one used in inverter for power back up in residential houses, it is 2. We complain sometimes about our house inverter lasting for hours not days (especially in Asia), now you know that inverter’s low ESOI is to blame!
Li-ion batteries adoption in two and four-wheeler electric vehicles (EV) transport is going up steadily, but their ESOI value is still prohibitive for ship or air transport unless there is a breakthrough in battery chemistry to store much higher charge density. Also, the rise in the EV industry is going to put more mining pressure on critical metals needed for the batteries in the long term. This would result in energy extraction and processing costs increasing super-linearly with declining ore grade[6] as we mine deeper. This will tend to worsen EROI for metal mining, subsequently putting long term price pressure on EV vehicles.
Probable impact of plateauing of global EROI
As it is unlikely that nuclear energy will impact on a timescale sufficiently short to impact our current climate change crisis, we must reconcile with the fact that we have energy sources of EROI or ESOI around 10-15 in our reserves, which is comfortable but cannot give us the immense industrial rate of growth which we have experienced in the last two decades, especially in China and India. At the societal level, declining or stagnant EROI means that an increasing proportion of energy output and economic activity must be diverted to attaining the energy needed to run an economy, leaving less discretionary energy available for “non-essential” purchases which primarily drives the GDP in our modern capitalistic economy. Economic degrowth would slowly be inevitable. Higher cost of living will be the norm for declining EROI phase. Developmental projects will not happen at the same pace as before as contracting companies become more prudent with the energy costs. Also, extreme climate events (floods, heatwave, wildfires, crop loss) will further slow down the pace of such projects. To make matters worse, lower EROI phase will result in slower damage control and longer recovery time from extreme climate events, eventually resulting in highly constrained and stop-gap nature of development projects.
Impact of lower EROI on job creation
Another non-obvious impact of lower EROI of renewables as compared to fossil fuels is that the number of skilled jobs will be lower and with lesser pay as renewable energy companies do not have higher profits (coming from higher EROI) to pay the labor force like the traditional oil and gas companies. Higher EROI can afford greater division of labor hence job reduction will ensue in the renewables industry. Overall, transition to a ‘green’ economy from oil and gas economy is not a like-to-like replacement from a labor benefit perspective.
Impact of carbon removal projects on lowering industrial EROI
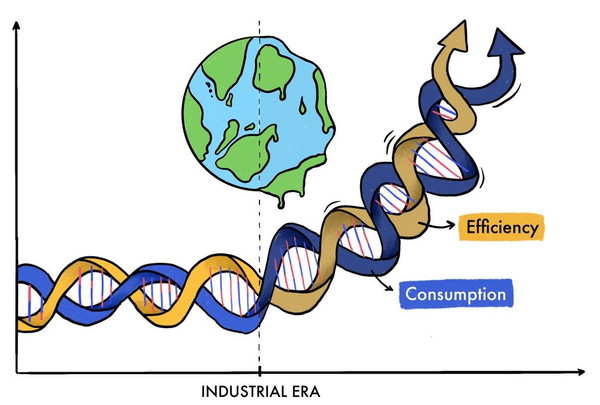
The climate crisis is worsening with each passing year, so does the responsibility to remove our historical and current carbon emissions. Lot of pilot projects are being tested across the world to remove carbon such as direct air capture, enhanced rock weathering and mineralization, ocean sequestration etc. These projects are broadly classified as carbon capture storage (CCS) or carbon capture use (CCU) technologies. As regulations get tightened globally for industrial decarbonization, coal gasifiers, oil upgraders and refineries, steam methane reformers (for hydrogen fuel) would need to be paired up with CCS or CCU technologies for emission reduction. This in turn reduces the EROI for these industrial units as spare output energy from the fuel needs to be diverted to build and maintain these CCS or CCU setups. Financing cost of these industrial setups remains expensive, running upwards of $100 per tonne of CO2 and we need to capture and store CO2 in the order of billion tonnes per year by 2030[7]. To give context of the deficit in our emissions removal we are currently capturing and storing CO2 in the order of million tonnes per year[8]. So, we are off by 3 orders of magnitude (1000x deficit) in carbon removal to give a sense of the global scale of the climate crisis and the energy and financial burden to support the carbon removal operations. If we do not voluntarily allocate our industrial fossil fuel energy now on CCS or CCU setups, we will end up forcefully allocating it at a higher cost in the coming years when the extreme climate events take even a bigger toll. So better to prioritize voluntary climate mitigation now than forceful and expensive climate mitigation and adaptation later, as illustrated below in Figure 2.

We are looking at a future where global EROI is constrained simultaneously from the depletion of concentrated energy sources and the massive engineering workload to bridge the emission reduction deficit gap.
EROI of extreme energy projects
Our insistence to maintain current standard of living and consumption forces us to explore extreme energy projects like asteroid mining and deep-sea mining. Academic research on such projects is very nascent, hence reliable EROI data is not available for this article. I strongly suspect EROI would not be favorable for scaling up such projects to go along with marine ecosystem damage in the case of deep-sea mining. Thankfully, International Seabed authority recently decided[9] to keep all deep-sea mining projects from different countries on hold to ensure the negative impacts are fully understood before green lighting of such projects.
Conclusion
The reality is that fossil fuels will have to remain a major part of the global energy mix in the foreseeable future to sustain our current standard of living and also meet following competing global energy workloads. Firstly, fossil fuels are still needed to develop and deploy the infrastructure for renewables- build and transport the solar panels and wind turbines to their destination, build factories to develop batteries for storage, mine critical and rare earth metals for EV's etc. Secondly, fossil fuels are needed to build the industrial CCS and CCU setups to scale up the carbon removal workload. Thirdly, with the rise of Artificial intelligence, massive computing power requirement would be needed to operate the cloud data servers in the future and that will take a fair share of the output from coal powered thermal plants across the globe. Fourthly, fossil fuels will also be spent, unfortunately, in wars like ongoing Russia-Ukraine war and Hamas-Palestine conflict or in hard-to-justify space exploration of Mars. So, considering all these workloads we cannot weave away from fossil fuels immediately despite their high emission intensities. At the same time, our dependence on fossil fuels compromises our emission target goals for 2030 and exacerbate the crisis of extreme climate events across the globe.
The precautionary and proactive way to solve this problem is to reduce our energy consumption (especially the higher economic rung of the society) until, at least, low carbon energy landscape (renewables +storage) reaches a certain threshold level of energy coverage in the face of competing global energy workloads. By doing this we also give developing countries much needed buffer time (through minimizing average global temperature rise) to develop their climate adaptation solutions across the globe. The masses remain highly resistant to this proposal. In an ideal fair world, a detailed energy accounting and planning would be done by an organization like UN to balance the energy expenditure for global wellbeing of masses and the energy required for carbon removal projects. All countries would then adhere to that global policy. Unfortunately, we are finding hard to reach such consensus and finalize effective policies like for example significant loss and damage fund for developing countries at global events like COP.
In the light of plateauing of global EROI, lot of our current and near future choices of the global rich comes into scrutiny. The current lifestyle of the ultra-rich (private jets, space tourism, yachts etc.) is very wasteful and unfair to the masses from energy equity perspective, especially to the people in developing countries trying to reach a level of development stated under UN sustainable development goals. The wealth inequality feeds into energy access inequality in a reinforcing loop.
Some aspects of our current global ‘green economy’ are doing more harm than good and distracting us from the EROI constraints. Carbon offset projects, which helps avoid future emissions and are traded as credits in the voluntary carbon market, is one such major distraction. Carbon offset projects can only be a tertiary solution in the face of the enormous energy workload of carbon removal projects. Other distractions come from the misleading labels like ‘sustainable aviation fuels’ ‘carbon neutrality’ etc. All of this gives us an illusion that we can continue to live our current lifestyle and let new technologies and free markets take care of the climate crisis. Behavioral changes from the consumers and through regulations from policymakers is underappreciated and disincentivized.
Ultimately, the global EROI constraints get masked in this form of ‘green capitalism’ and gets only visible in the form of price inflation of energy for the end consumers. The governments intervene with fossil fuel subsidies to keep the price under control, but in the long run we are only avoiding the inevitability of declining global EROI and worsening climate crisis.
PS: If you liked this article, you would enjoy browsing the comic on 'Energy slaves' by Australian comics artist Stuart Mcmillen.
In the spirit of transparency on the originality of content writing, I would like to disclose that ChatGPT or similar technology was not used to augment the data analysis or content in this article. I felt that it would be intellectually more satisfying if I do the content exploration on my own for this article. I may use AI tools for future writings. In the same spirit, the cover illustration for this article was done by a local graphic illustrator without the help of AI tools like DALL-E or Midjourney to lend a more human touch.
Appendix
Source description and data for Figure 1: The energy production data (in TJ) for Figure 1 is taken from IEA energy statistics data browser[10] except for geothermal, which is taken from Global Geothermal alliance 2021 report[11]. Although it would be more relevant to analyze 2023 global energy production data, IEA publicly available data was only till 2020. Also, global fossil fuel usage has gone up in the last two years along with renewable installation, so relative bubble sizes would remain almost unchanged for 2023.
The emission intensity data is taken for the entire lifecycle of energy production and is validated from Electricity Maps[12], a reliable open-source database. EROIST data of fossil fuels is interpreted from 2021 research paper in Journal of Applied Energy [13] . A study[14] on biofuels in Ecuador was used to get EROI range of commonly used biofuels. EROI of geothermal was accessed from a 2012 technical report[15] by US Department of Energy. It is expected that geothermal's EROI would be improved slightly by now. EROI of wind and solar was taken from 2020 research paper[16] in energies, published by MDPI. EROI of hydro was referenced from 2019 research paper[17] in Energy strategy reviews. EROI of coal and nuclear was referenced from 2015 Forbes article. All the data for Figure 1 is shown in the table below:

Data for fuel cells:
ESOI values of Li and hydrogen cells are taken from two[18,19] research papers.
References
[1] Illustration by Jan Konietzko to show narrow focus on carbon emissions in the mainstream climate change discussions.
[2] Charles AS Hall 2013 Scientific American interview transcript (https://www.scientificamerican.com/article/eroi-charles-hall-will-fossil-fuels-maintain-economic-growth/)
[3] NREL 2023 Annual technology baseline data (https://atb.nrel.gov/electricity/2023/index)
[4] Guardian article December 2022 (US scientists confirm ‘major breakthrough’ in nuclear fusion | Nuclear power | The Guardian)
[5] Medium article March 2023 (What does it take to build a commercial hot fusion reactor? | by Eshel Lipman | Extantia Capital | Medium)
[6] Koppelaar et al 2016 (The Ore Grade and Depth Influence on Copper Energy Inputs | SpringerLink)
[7] IEA report 2022 (Capacity of large-scale CO2 capture projects, current and planned vs. the Net Zero Scenario, 2020-2030.)
[8] Canary Media article, May 2023(Chart: Carbon capture and removal projects hit a… | Canary Media)
[9] Guardian article July 2023 (International talks end without go-ahead for deep-sea mining | Deep-sea mining | The Guardian)
[10] IEA Energy statistics 2022 (Energy Statistics Data Browser – Data Tools - IEA)
[11] Global Geothermal alliance report 2021(Geothermal - The Solution Underneath (globalgeothermalalliance.org)
[12] Electricity Maps real time database of emission intensities of global energy production (Electricity Maps)
[13] Delannoy et al 2021 (Peak oil and the low-carbon energy transition: A net-energy perspective - ScienceDirect)
[14] Chiriboga et al 2020 (Energy Return on Investment (EROI) and Life Cycle Analysis (LCA) of biofuels in Ecuador - ScienceDirect)
[15] Mansure A.J 2012 (Engineered Geothermal Systems Energy Return On Energy Investment (Technical Report) | OSTI.GOV)
[16] Castro et al 2020 (Energies | Free Full-Text | Standard, Point of Use, and Extended Energy Return on Energy Invested (EROI) from Comprehensive Material Requirements of Present Global Wind, Solar, and Hydro Power Technologies (mdpi.com))
[17] Capellán-Pérez et al 2019 (Dynamic Energy Return on Energy Investment (EROI) and material requirements in scenarios of global transition to renewable energies - ScienceDirect)
[18] Few et al 2015 (Energy Storage for Balancing Intermittent Renewables: Outlook for a Range of Technologies up to 2030, Informed by Expert Elicitation and Historical Data)
[19] Palmer et al, 2021 (Life-cycle greenhouse gas emissions and net energy assessment of large-scale hydrogen production via electrolysis and solar PV - Energy & Environmental Science (RSC Publishing)

Buy me a coffee (link below) or support via Paypal if you enjoyed reading this post and found it insightful!
Content writing for Anabe Labs by Rajesh Hegde is licensed under CC BY-SA 4.0![]()
![]()
![]()
